Setup
Prerequisite
Grafana plugins
Optional
Get the backend/template
- Using template (requires git)
- Using ZIP file
- Go to grafana-360-viewer-backend-template.
- Click "Use this template" and make a repo from the template.
- Download the newly created repo onto to your local machine.
- Go to grafana-360-viewer-backend-template.
- Download the repo onto to your local machine. Click on "Code" then "Download ZIP".
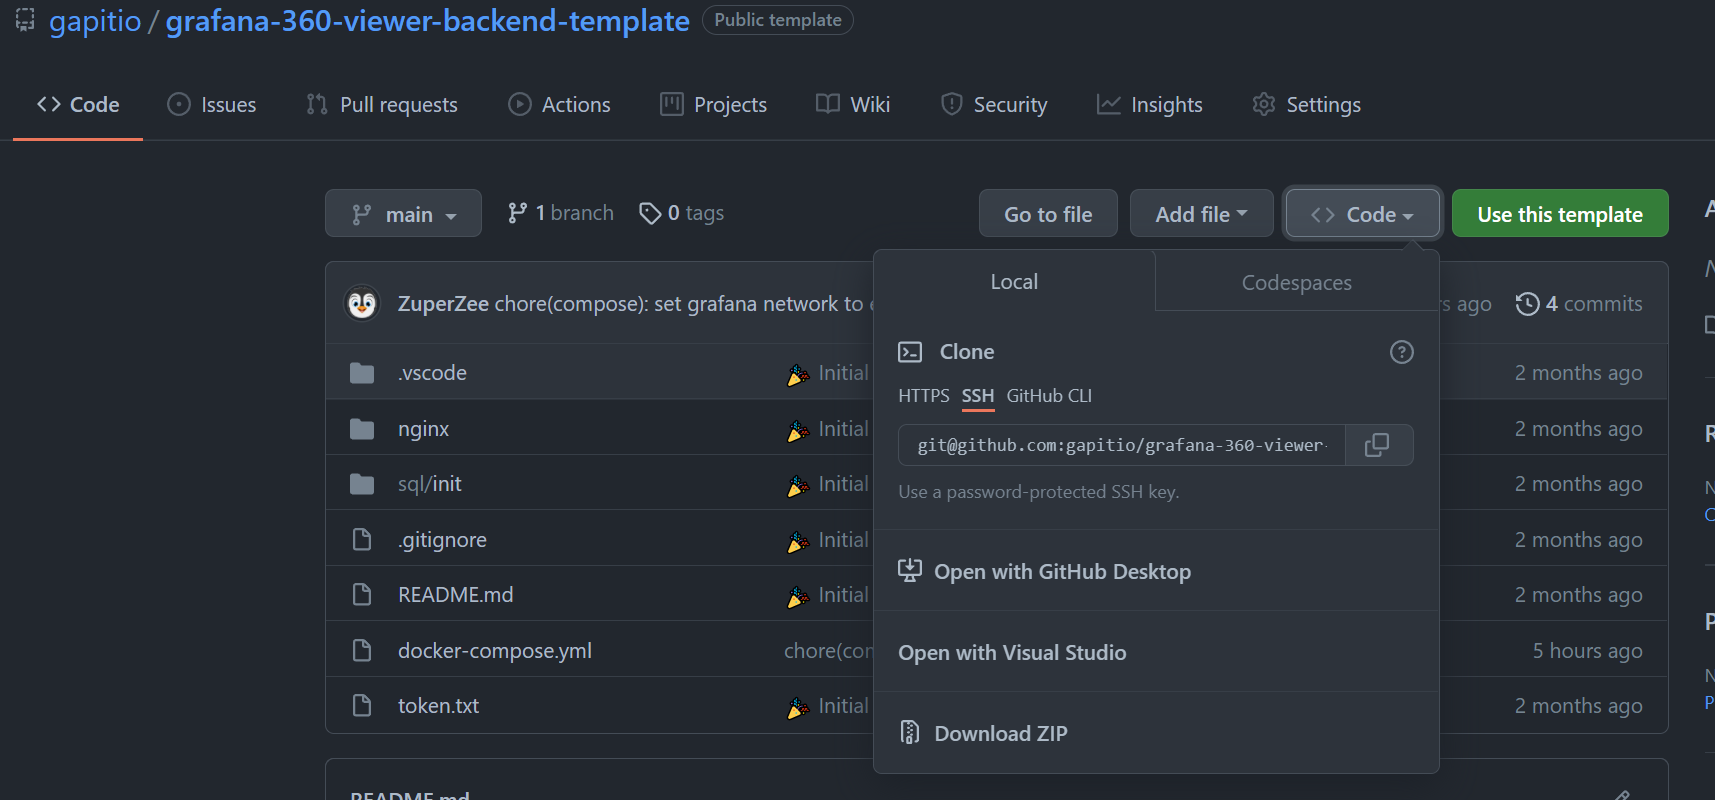
- Unzip the zip file.
Configure the backend
- Grafana installed with docker
- Grafana installed with other methods
Set the correct network name in the docker-compose.yml file. The network name should (usally) be the same as the grafana service network name.
Change your password and token. Guide: How to change password.
Change your password and token. Guide: How to change password.
Run the backend
tip
Start the backend on boot or when the docker restarts. Guide: How to start backend on boot.
To start the backend with docker compose. Go to the folder with the docker-compose.yml file (the backend folder that was downloaded previously) and run the following command.
docker-compose up -d
Setup grafana data source (JSON API)
Add the JSON API data source. Guide: Add a data source.

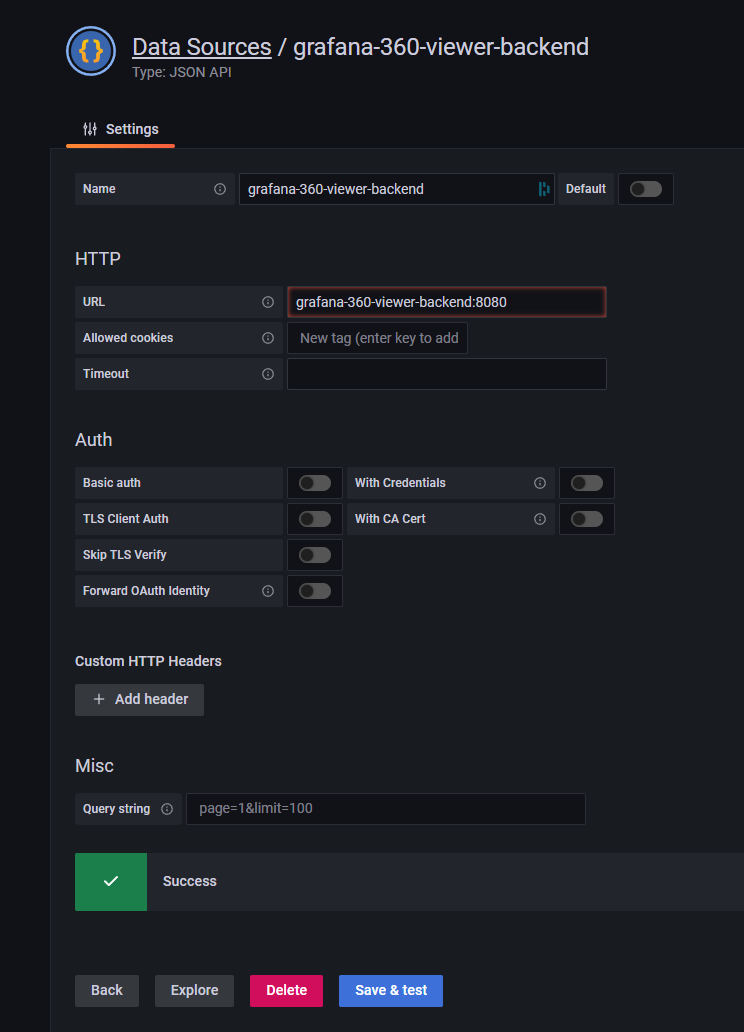
With the following settings.
Name can be anything and URL has to be the nginx container name and the port number
- Grafana installed with docker
- Grafana installed with other methods
Name can be anything and URL has to be the nginx container name and the port number
- Name = grafana-360-viewer-backend
- URL = grafana-360-viewer-backend:8080
Name can be anything and URL has to be the nginx container name and the port number
- Name = grafana-360-viewer-backend
- URL = localhost:3203
Get the data source id
Open the developer tools in your browser (Control+Shift+I) and navigate to the network tab.
Click on "Save & test".
Note down the number in the network tab (Needed for later).
Setup dashboard
caution
Some errors might pop up on the dashboard. Like Error updating options: invalid input syntax for type integer: "". This is expected as there is nothing in the database. Don't worry about it yet.
You can import the following panel json (download). Guide: Import dashboard.
Or you can add the dashboard manually by following the below steps.
Setup variables
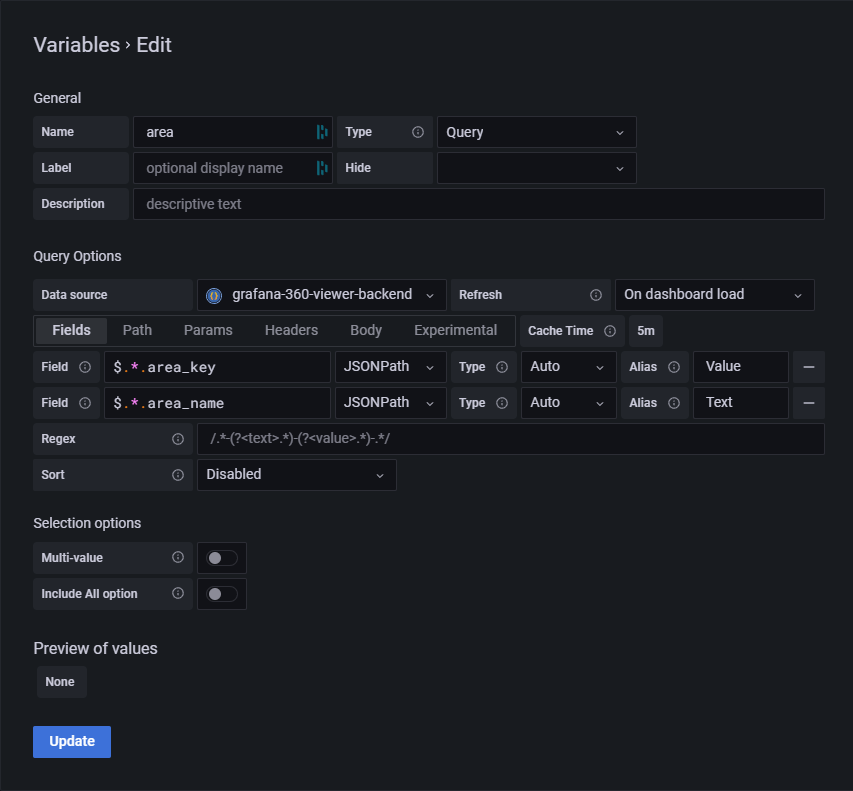
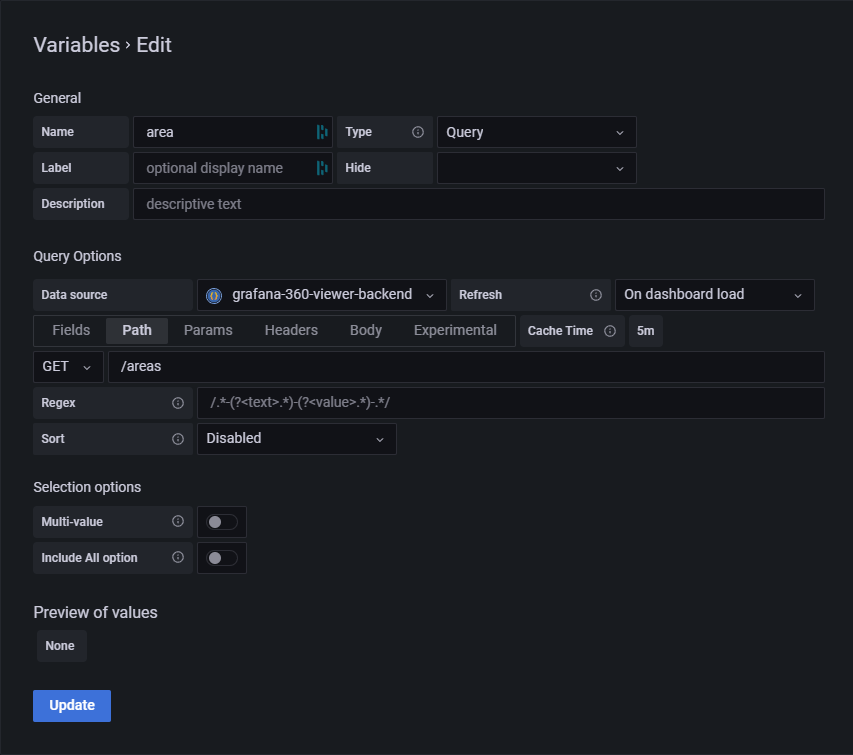
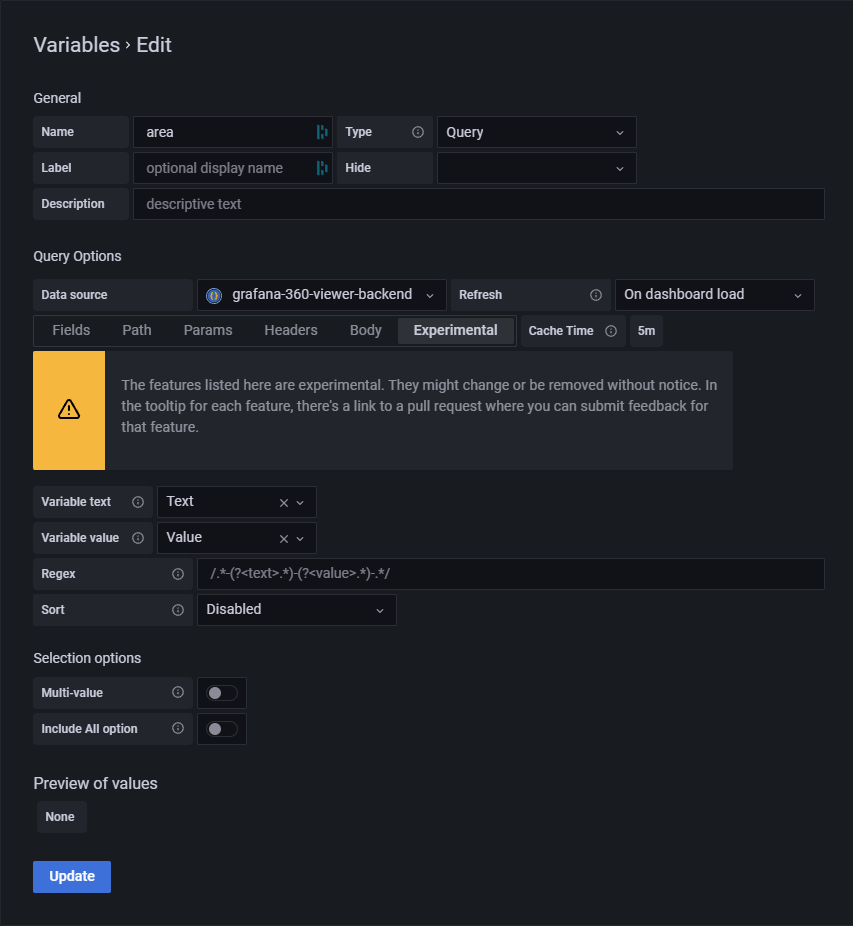
area
- Variable name =
area - Type =
Query
Query options taken from the json model (templating -> query). If the json seems complicated you can just look at the images below.
query options
{
  "cacheDurationSeconds": 300,
  "experimentalVariableTextField": "Text",
  "experimentalVariableValueField": "Value",
  "fields": [
    {
      "jsonPath": "$.*.area_key",
      "name": "Value",
      "type": "number"
    },
    {
      "jsonPath": "$.*.area_name",
      "language": "jsonpath",
      "name": "Text",
      "type": "string"
    }
  ],
  "method": "GET",
  "queryParams": "",
  "urlPath": "/areas"
}
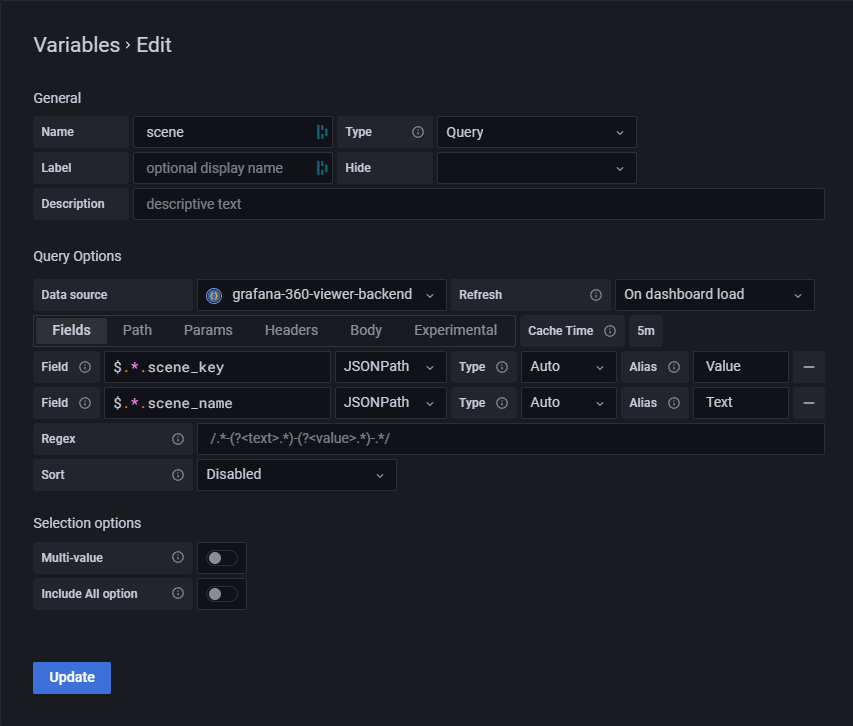
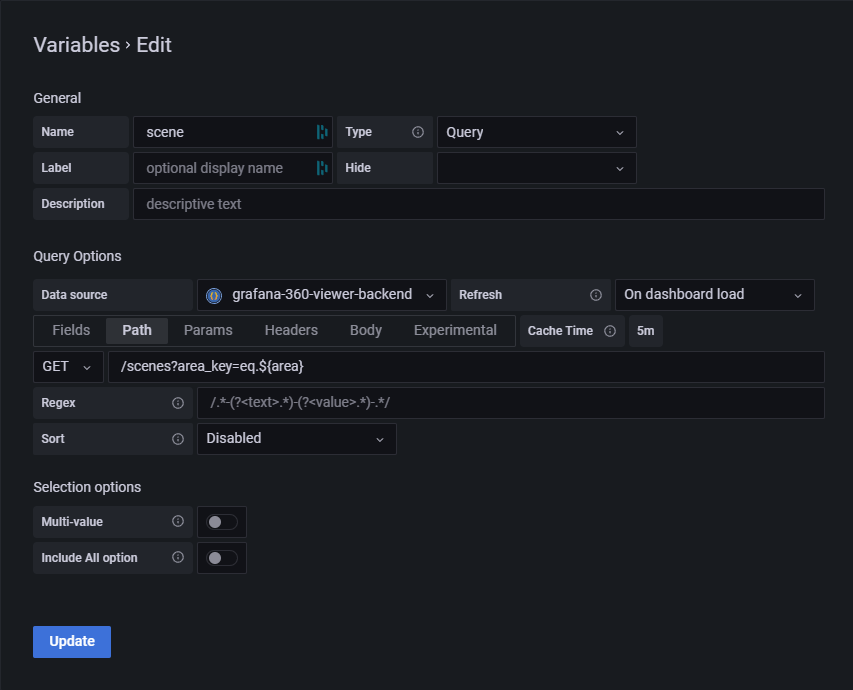
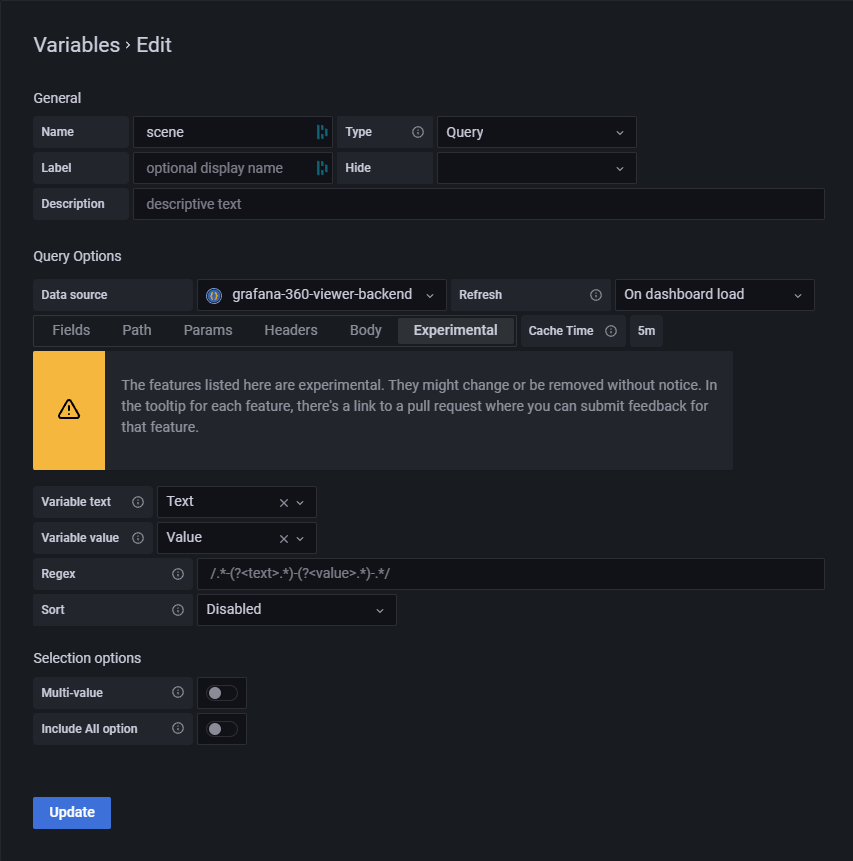
scene
- Variable name =
scene - Type =
Query
Query options taken from the json model (templating -> query). If the json seems complicated you can just look at the images below.
query options
{
  "cacheDurationSeconds": 300,
  "experimentalVariableTextField": "Text",
  "experimentalVariableValueField": "Value",
  "fields": [
    {
      "jsonPath": "$.*.scene_key",
      "name": "Value"
    },
    {
      "jsonPath": "$.*.scene_name",
      "language": "jsonpath",
      "name": "Text"
    }
  ],
  "method": "GET",
  "queryParams": "",
  "urlPath": "/scenes?area_key=eq.${area}"
}
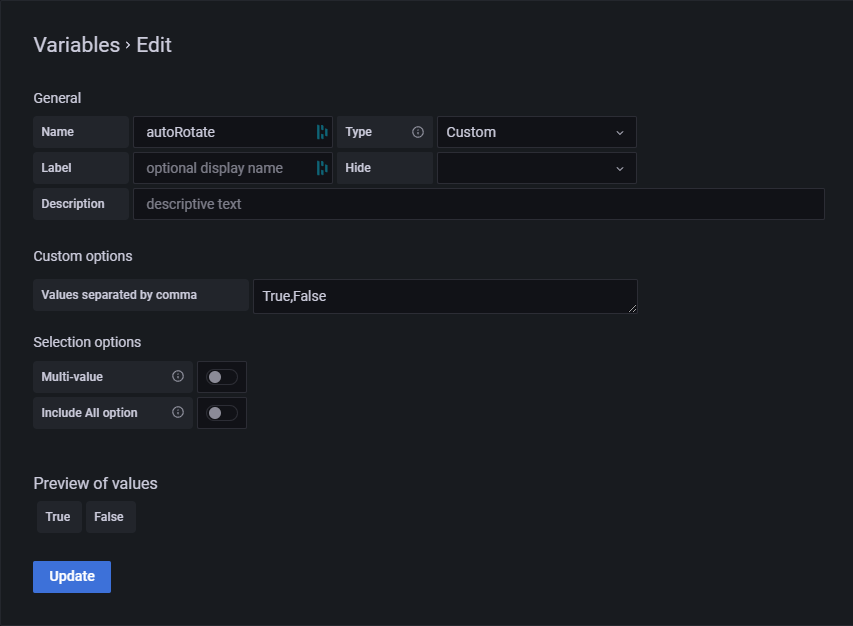
autoRotate
- Variable name =
autoRotate - Type =
Custom - Values separated by comma =
True,False
[
  {
    "selected": true,
    "text": "True",
    "value": "True"
  },
  {
    "selected": false,
    "text": "False",
    "value": "False"
  }
]
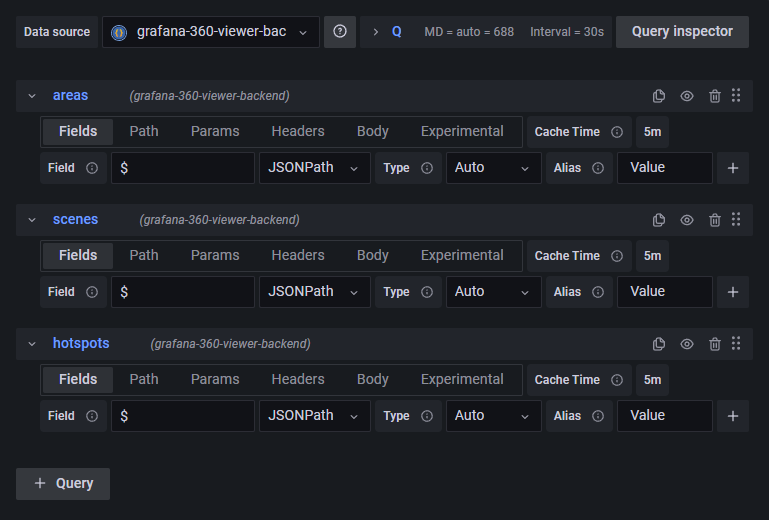
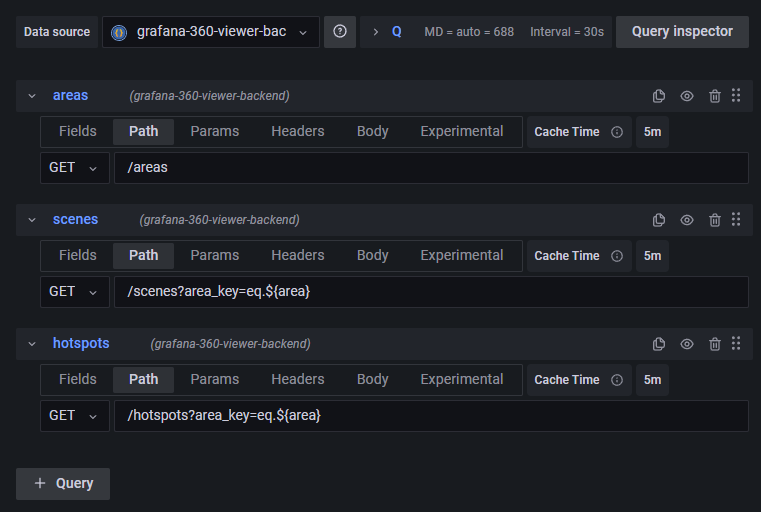
Setup queries
Create a panel. Guide: Add a panel
Create a 3 queries. areas, scenes, and hotspots.
Query targets taken from the json panel model. If the json seems complicated you can just look at the images below.
caution
Change the uid if you're using the json model.
[
  {
    "cacheDurationSeconds": 300,
    "datasource": {
      "type": "marcusolsson-json-datasource",
      "uid": "datasource-uid"
    },
    "fields": [
      {
        "jsonPath": "$",
        "name": "Value"
      }
    ],
    "method": "GET",
    "queryParams": "",
    "refId": "areas",
    "urlPath": "/areas"
  },
  {
    "cacheDurationSeconds": 300,
    "datasource": {
      "type": "marcusolsson-json-datasource",
      "uid": "datasource-uid"
    },
    "fields": [
      {
        "jsonPath": "$",
        "name": "Value"
      }
    ],
    "hide": false,
    "method": "GET",
    "queryParams": "",
    "refId": "scenes",
    "urlPath": "/scenes?area_key=eq.${area}"
  },
  {
    "cacheDurationSeconds": 300,
    "datasource": {
      "type": "marcusolsson-json-datasource",
      "uid": "datasource-uid"
    },
    "fields": [
      {
        "jsonPath": "$",
        "name": "Value"
      }
    ],
    "hide": false,
    "method": "GET",
    "queryParams": "",
    "refId": "hotspots",
    "urlPath": "/hotspots?area_key=eq.${area}"
  }
]
Setup grafana panel (HTMLGraphics)
- Add the HTMLGraphics panel. Guide: How to add the HTMLGraphics panel.
- Go to the latest release of Grafana 360 viewer and download the
grafana-360-viewer-<version>-panel-options.jsonfrom the assets. - Import the downloaded file to the HTMLGraphics panel. Guide: How to import/export.
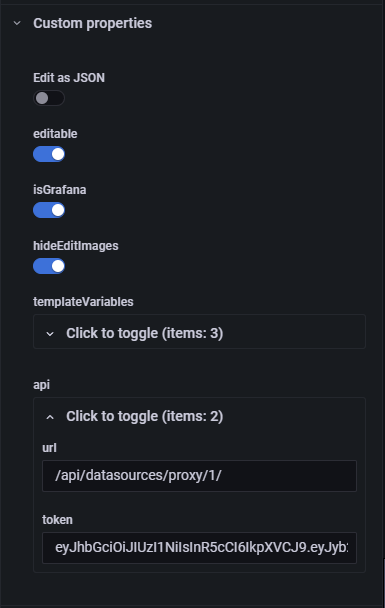
- Go to the Custom properties options on the sidebar.
- Change isGrafana to true.
- Change the api url to the proxy path.
/api/datasources/proxy/datasource-id/. datasource-id is the number from Get the data source id section. - Change the api token to token saved in the
token.txtfile. The token from Configure the backend section after changing the password and token.